Local Market Conditions Jan 2021
Local Market Conditions January 2021
The numbers are in for the Local Market Conditions January 2021. Not too surprising for the traditional winter season and following the same theme from the last few months.
Local Market Condition – Limited Inventory
We’ve heard this mantra A LOT in the last year+. The reason we are staying in a Seller’s Market is because there is not enough inventory to fulfill the demand from buyers for homes.
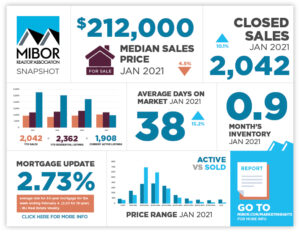
In January 2021, we went up a little to .90 months of inventory – still below a month’s worth. This statistic known as the “Absorption Rate,” is the number of months it would take to sell through the current available homes at the current monthly sales rate.
The National Association of Realtors describes a “Balanced Market” as between 5 & 7 months worth of inventory. With .90 months, we are well in a Seller’s Market.
January New Listings, Pendings and Closings
For January, the Metropolitan Indianapolis Board of Realtors reported the following numbers:
 New Listings – 2,362
(down 8.9% over Jan 2020)
New Pendings – 2,886
(up 8.9% over Jan 2020)
Closings – 2,042
(up 10.1% over Jan 2020)
This tells us that less new inventory of homes for sale hit the market in January than in January of 2020.
It also says that more buyers/sellers went under contract this January over last January and that more buyers/sellers closed on the purchase/sale of a home over last year by over 10%.
All these numbers certainly support the local seller’s market.
What About Home Values?
Yes, home values have been on the up-tick for quite some time. This report supports the increase in home price/value. The median home price in January 2021 what $212,000, up 16.2% from $182,500 in January 2020.
This means some homeowners are equity rich, but how many?
Nationally, there are 59 million mortgaged homes in the US and there are 38% of homes owned free and clear. It breaks down to 18.7% of all homes with a mortgage (62%) have at least 50% equity.
This means that when you combine the free and clear homes with those who have 50%+ equity, 56.7% of homes with a mortgage have a MINIMUM of 50% equity. This is MUCH better than in the housing bust of 2008-2009.
Mortgage Rates
We would be remiss not to mention mortgage interest rates. Again, they held in the high two’s at 2.73% for the week ending February 11th, 2021, according to FreddieMac.
This is historic low interest rates for buyers and something many want to take advantage of before they start heading upward again! This is part of the reason for the large demand for homes and why the inventory is having a hard time keeping up.
In central Indiana, builders are ramping up to help with the low inventory of existing homes. In Pendleton alone, there are 3 new subdivisions and all are selling like hotcakes! In Carrick Glen, they are getting ready to open the second phase of lots for homeowners.
Central Indiana Housing Market Summary – January 2021
The Indiana housing market continues to be amazingly strong – no sign of weakness, here according to the numbers.
Nationally, the housing market is a bright spot in our recovering economy and is likely to remain so. Experts predict 2021 sales should be able to maintain or come close to maintaining the strong levels of the 2020 housing market.
Jump in! The water is fine!!


Comment
Comments are closed.