July 2021 Indiana Housing Report
The July 2021 Indiana Housing Report showed a few signs of softening. It’s a welcome trend for haggard buyers in this years long Seller’s Market!
It will continue to be a Seller’s Market in the foreseeable future but at least we are seeing some positive changes for buyers.
July 2021 Indiana Housing Stats
 Most notable in the July 2021 Indiana Housing Report is an increase in new listings as well as active inventory. This report is compiled by the Metropolitan Indianapolis Board of Realtors (MIBOR) for the 16 county area in Central Indiana.
In June, New Listings was reported to be 4,386 and in July 4,392 – only a 0.1% increase but an increase all the same!
Active Inventory for June 2021 was 2,049, while July reported 2,498 – an increase of 21.9%. Buyers in the market are thrilled with the inventory loosening up a bit.
We also went from .50 months worth of inventory to .70 months. A welcomed increase of 40% in the Absorption Rate (the number of months it would take to sell through the available units at the current monthly sales rate.)
Madison, Hancock and Hamilton Counties in Indiana
Since the Real Estate Industry is hyper-local, let’s bring it a bit closer to home…
Madison County July 2021 Housing
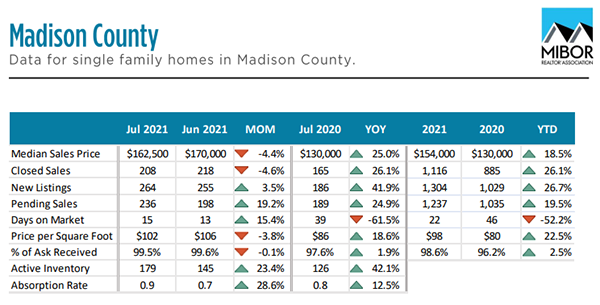
We can see a few key statistics for Madison County on the chart above:
- Median Sales Price Decreased, 4.4%
- New Listings are up 3.5% over June & 41.9% over July 2020
- Days on Market inched back up from 13 to 15 in July
- Inventory of homes is up 23.4% over June and we have .90 of a months worth
These stats all point to the local market softening just a bit. The demand is definitely still there but if these metrics continue, it will become easier for buyers to find the home they are searching for – unlike the Spring of this year.
Hancock County July 2021 Housing
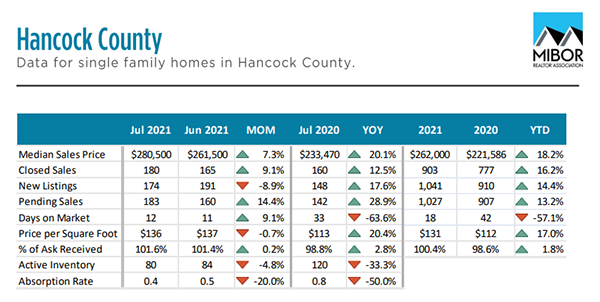
Hancock County’s statistics tell a different story…
- Median Sales Price is up 7.3% over last month to $280,500
- New Listings are down by 8.9% over June 2021
- Days on Market did increase by 1 Day to 12
But, the real interesting data is:
- Active Inventory is only 80 homes – down by 4.8% over June
- Absorption Rate fell from .50 of a month to .40 of a month
This says Hancock County still has high interest from Buyers and not near enough inventory to meet it.
Hamilton County 2021 Housing
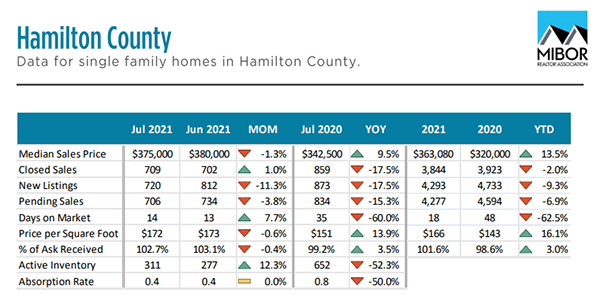
Hamilton County is similar to Hancock County in that the Absorption Rate is .40 months and new listings are down 11.3% from June’s numbers.
Other notables:
- Median Home Price is down from $380,000 in June to $375,000 in July.
- Active Inventory is up 12% to 311 home over the 277 in June.
- Days on Market also increased by one day to 14 Days
Summary
Shelley Specchio, CEO of MIBOR said, “Another welcomed surprise is the increase in new listings – up 3.8 percent over last year and the highest July level in a decade. This data, along with the increase in active listings, indicates sellers are becoming more comfortable with listing as they have more opportunities to find a suitable replacement home.”
Dr Elliot Eisenberg, Economist, says “Still, the Indianapolis market remains one of the strongest in the country and I don’t see it suffering any real setbacks anytime soon.”
Overall, the Central Indiana Housing Market is still very much in a Seller’s Market but is softening a bit. With Mortgage Interest Rates hovering at near record lows, even with a shortage of homes, it’s a great time to buy a home!